grid capital logo
under construction — please contact +1 970 452 16 46

Outlook on EOG Resources Inc (EOG)

EOG Resources, Inc., together with its subsidiaries, explores for, develops, produces, and markets crude oil, and natural gas and natural gas liquids. Its principal producing areas are in New Mexico and Texas in the United States; and the Republic of Trinidad and Tobago. The company was formerly known as Enron Oil & Gas Company. EOG Resources, Inc. was incorporated in 1985 and is headquartered in Houston, Texas.


Preliminary industry analysis

Analysts have revised their fair value estimate for EOG shares, lowering it from $112 to $97 per share. This change is driven by two main factors: 

1. firstly, the decline in short-term commodity prices has put pressure on the company’s earnings, 

2. secondly, there is a higher cost inflation than expected, which has also negatively impacted the company’s earnings. 

In 2023, the company plans to increase capital expenditures by approximately 30%, amounting to $6 billion, compared to the previous forecast of $4.6 billion. This increase largely reflects the increased activity of the company, which, despite a challenging market, aims for moderate growth in production volumes. 

The company’s management announces plans to increase oil production by 3% and overall volume by 9% in 2023. To achieve these goals, the company plans to launch two additional drilling rigs and put 80 clean wells into operation at its fields. 

Despite this change, the company’s competitiveness will not suffer, as the reduction in the firm’s valuation is due to other factors. EOG’s cost advantage is linked to high-quality areas with a low base, which remains relevant. However, in the next couple of years, the company will need to invest $1-2 billion more than previously anticipated.


Business strategy and prospects

The EOG Corporation is a leading participant in the oil and gas extraction industry, with a primary focus on extracting shale formations in the United States, as well as a small share of operations in Trinidad. The company’s success lies in its ability to identify prospective development areas ahead of competitors, negotiate land leases at attractive prices instead of overpaying for already popular sites. Its recent major deal was its involvement in the Permian Basin project in 2016. Currently, EOG is actively involved in several other shale extraction projects, including Bakken and Eagle Ford.

Additionally, the company has turned its attention to the Powder River Basin and a new gas field in southern Texas called “Dorado”. Like many other companies in the industry, EOG adheres to a capital management policy and aims to return no less than 60% of its annual free cash flow to shareholders through special dividends.

In recent years, EOG has been actively expanding its premium segment, developing new assets, and expanding its operations. Thanks to its scale and diversity, the company has accumulated significant experience in shale extraction, enabling it to quickly adopt new technologies and achieve high production levels.

Initial extraction results at new sites often exceed industry averages, indicating EOG’s high operational efficiency. The company’s size allows it to rely less on external contractors and negotiate more successfully with suppliers during periods of high inflation, ensuring favorable collaboration conditions.


Bull’s opinion

EOG Corporation stands out for its high level of technical equipment in the industry. 

The company’s shale well production consistently exceeds market averages. 

Instead of engaging in costly mergers and acquisitions, the company leverages its expertise in geological exploration to identify new promising sites before other players enter the game and start driving up land prices. 

Owning assets in various basins allows the company to reallocate capital according to market conditions, prioritizing oil or gas production volumes as needed and avoiding areas with excessively high drilling costs.


Bear’s opinion

In 10-15 years, EOG Corporation’s reserves may be depleted if the company fails to find new drilling sites. 

Instead of using a more transparent and predictable method, EOG prefers to pay special dividends to shareholders to return excess funds. 

The scale of EOG’s operations is a double-edged problem; the company is forced to exert more effort to maintain its production base and drilling rig inventory.

HISTORY POINTS TO FAVOURABLE OUTLOOK FOR BIOTECH IN 2024

After a two-year decline in the fiscal year 2021/2022, the positive mood in the biotechnology industry continued in early January. This indicates favourable prospects based on historical data for the years 2000-2023, where early positive results foreshadowed a successful year. The rapid mergers and acquisitions of companies in the fourth quarter and the first few weeks of January further support optimism.

The expected reduction in interest rates should be an additional incentive for shares of biotech companies with a high beta coefficient and small market capitalization.


An Encouraging Start To 2024 

After a five-year period of excellence in 2011-2015, the biotech sector began to underperform the Nasdaq market from 2016 to 2021 for six years and the S&P 500 for four of those six years, indicating the length of the capital cycle. In 2022, the biotechnology sector began to improve again, and although its productivity lagged again in 2023, biotechnologies returned to their previous level and still ended the year with a moderate positive annual income.

The year 2024 was marked by a good start. The NBI grew by +2% by the end of the HC annual conference. A positive start for biotechnology correlates with positive returns in most cases. In addition, the NBI outperformed the broader market by +2.4% and +1.9% compared to the Nasdaq and S&P 500 by the end of the HC annual conference. Support from mergers and acquisitions also continued into the new year, with four deals announced in early January (of which two were >$1B), after Q4 ended with a significant surge in acquisitions.


Nasdaq Biotechnology Index

In 2024, the Nasdaq Biotechnology Index (NBI) showed a yield of +2% from January 1 to January 11 (before the end of the HC conference). In the last 24 years, there have been 18 years when the NBI had a positive start to the end of the conference, and in 14 of those 18 years (78%) this start was associated with positive returns for the rest of the year. The average return for the period from the end of the conference to the end of the year was +11% (the average annual return was +17% in these years).

On the other hand, the negative start for the NBI index in early January (before the end of the conference) is associated with a general negative indicator for the remainder of the year in 4 out of 6 years (4 out of 5, if we exclude 2009, which began almost unchanged), an average yield of -6% (the average annual return is -13% in these years).


Positive returns in 2023 and prospects for 2024

The biotech sector ended 2023 with positive returns despite an increase in interest rates. Interest rates continued to rise in the first half of 2023 before rate increases softened in the second half. Nevertheless, biotechnologies ended the year with an increase. In addition, our analysis shows that there is no correlation between the performance of biotech indices and interest rates.

Yields on 10-year Treasury bonds have risen in 11 of the last 24 years, with yields for biotech indexes ranging from -1% to 9% in those years.However, in 7 of these years (64% of the time), biotech indices showed positive annual returns. Expectations of a reduction in interest rates in 2024 have removed some investor concerns about worsening macroeconomic pressures. But history shows that an increase in interest rates has mostly not been a major risk to the sector’s productivity.

In 2024, biotechnologies will continue to be driven by investment sentiment and other macroeconomic factors (e.g. fund flows, mergers and acquisitions, FDA performance).


M&A 

The volume of transactions and their value in 2023 ended successfully – the momentum continued in early January. Investors were also interested in how the deals compared to previous years. The volume of transactions and the total value of transactions from 2017 to 2023 for transactions worth more than $1 billion are analysed. In 2023, 23 transactions worth more than $1 billion were concluded, while the average annual number of such transactions from 2017 to 2022 was about 10.

The total value of these 23 transactions was $146 billion, which exceeds the average value of transactions from 2017 to 2022, which was about $91 billion, but was distorted by Pfizer’s announced acquisition of Seagen in March 2023 for $43 billion. 

M&A deals continued to evolve into 2024, with four M&A deals announced in early January, two of which were worth more than $1 billion (JNJ’s acquisition of Ambrx for $2 billion and GSK’s acquisition of Aiolos Bio for $1 billion).

These early trends in M&A are encouraging and put us on the right track for 2024.

Positive outlook for U.S. drug prices

Drug prices are a constant concern for investors in the biopharmaceutical industry. Drug prices in the United States will continue to rise as the innovations offered by many medicines are effective. A survey of drug buyers in the United States over the past 29 years has shown that drug prices continue to rise despite multiple reforms, pricing fears and election cycles.

Buyers who took part in the survey in December 2023 expected that the average cost of purchasing branded medicines per unit would increase by 8% over the next three years (+12% on a weighted average). Fifteen percent of respondents attributed a significant (75%) portion of the expected price increases over the next three years to a shift to more expensive new therapies, as opposed to 19% last year. Only one respondent, representing only 1% of drug costs among the surveyed payers, predicts a decrease in drug prices over the next three years. The survey results are based on responses from 27 HMOs, PBMs and hospitals.

In total, they purchased medicines worth about $144 billion in 2023, which is about a fifth of total drug spending in the United States.


Implications for financial and industry models

The optimistic outlook for the biopharmaceutical sector takes into account the favorable dynamics of production and the absence of negative effects of drug prices in the United States. This gives confidence in production forecasts, which are key growth factors in the coming years. The Inflation Reduction Act (IRA) provides mechanisms to control drug prices from 2026. Half of the respondents believe that the law has a moderate (25%) impact on drug prices over the next 3 years. No payer expects a significant (75%) impact on drug prices, and 23% of buyers believe that the IRA will have no impact.

When asked about the likelihood of an IRA bill assistance provision affecting drug use in 5 years, 42% of payers replied “Probably without impact.” The prospects for biosimilars are also in the spotlight. Over the past few years, there has been a steady trend in which payers expect biosimilars to take an increasing share of the market, especially when several biosimilars compete with one original product.

This trend has coincided with an increase in the number of high-tech branded biologics with high sales and value coming out of patent, an example of which is Humira. Despite the drop in profits from off-patent drugs, overall average drug prices are still expected to increase in line with previous years.


Average prices for branded medicines 

The cost of purchasing branded medicines per unit has increased by an average of 5% over the past 12 months, while the weighted average has increased by 9%, which is very similar to the changes of +4% and +6% in 2022. Eleven percent of the respondents attributed a significant (75%) part of the increase to a shift in their purchases towards more expensive new drugs, while 59% attributed a moderate (50%) part of the increase to new drugs, and 15% – a small (25%) part. In last year’s survey, these figures were 19%, 27% and 54%, respectively.

The products/categories that were most often mentioned as having the greatest impact on product range renewal included oncology, diabetes, rheumatology, genetic/cell therapy, obesity, dermatology and gastrointestinal tract. This is very similar to last year, although obesity has risen in the list.

The political structure of the executive and congressional branches of the federal government does not seem to correlate strongly with price trends for branded medicines.


Customer expectations 

Over the next 12 months, the average cost of purchasing a unit of general medicine is expected to increase by about 2%, but decrease by about 1% on a weighted average. After 3 years, our respondents predict that the average cost of purchasing a unit of general medicine will increase by about 2%, although the weighted average will be -1%.

The cost of purchasing branded medicines per unit is expected to increase by 8% over the next 3 years. In terms of the weighted average, payers predict an increase of 12%. The latter is slightly higher than last year’s three-year forecast and represents a continuation of the trend towards double-digit price increases. The most frequently mentioned as those likely to have the greatest impact on overall drug price inflation over the next 3 years were oncology, genetic/cell therapy, and diabetes.

With the increase in the use of GLP-1 (a category specifically mentioned by several payers), the increase in cost was associated with diabetes drugs. Due to the advent of Humira biosimilars, rheumatology has become a less frequent choice compared to the past.


The Law on Limiting Inflation

A survey of payers regarding expectations regarding the impact of the Law on Limiting Inflation on drug pricing and use yielded the following results. The Inflation Reduction Act (IRA) will abolish catastrophic co-insurance and limit the annual out-of-pocket costs of patients suffering from Part D of the Medicare program (an additional program of the US federal government that helps Medicare beneficiaries pay for prescription drugs themselves).

Half of the respondents believe that the law is likely to have a minor (25%) contribution to changes in drug prices over the next 3 years, 27% of payers believe that the effect will be moderate (50%). None of them foresee a significant (75%) impact on drug prices, and 23% of buyers believe that the law will have no impact.

The categories considered most vulnerable to the provisions of the Law on Limiting Inflation were diabetes, oncology, rheumatology, cardiovascular diseases and obesity.

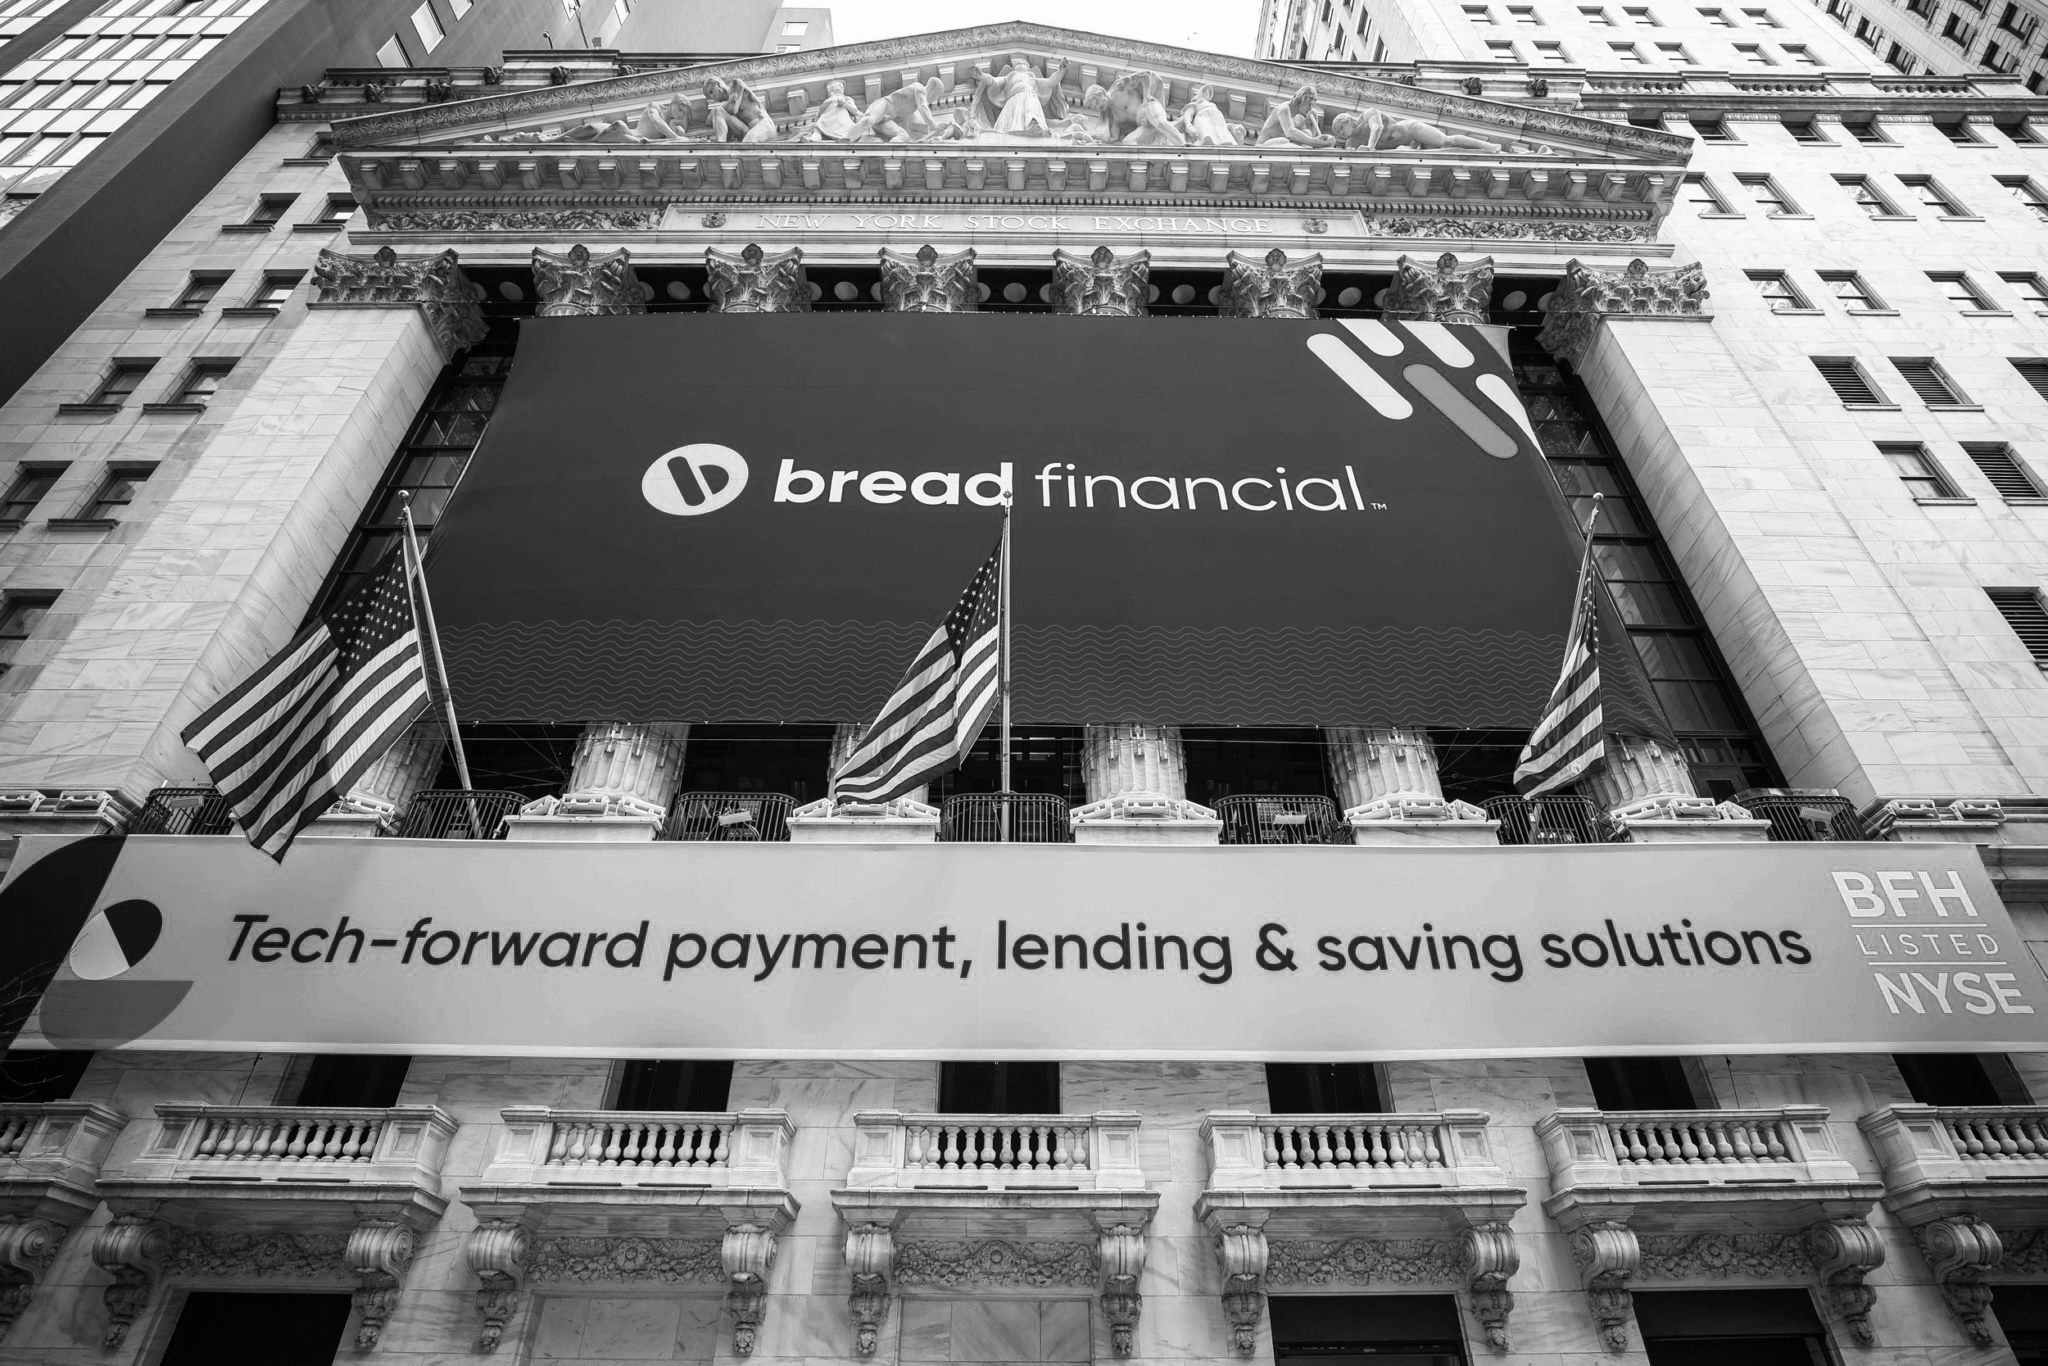
Bread Financial Holdings, Inc. (BFH)

Fair Value – 49 USD    Market cap. – 1.4 USD Bil


Business strategy and prospects

After the sale of Epsilon in 2019 and the spin-off of LoyaltyOne in 2021, Bread Financial is now exclusively a consumer credit company, issuing credit cards under its own brand and buy now/pay later businesses are the only two product lines. However, Bread’s retail credit card business is under pressure as it continues to lose major partners, losing to Wayfair and Meijer in 2020, and BJ’s wholesale club to Capital One in early 2022. It is worth considering the loss of a retail partner as a constant threat to Bread, since the company does not have a competitive advantage that would give it an advantage in maintaining partnerships during contract extension negotiations. 

Bread also has to contend with competitive threats from BNPL firms that target the U.S. retail market and seek to sign agreements with Bread partners. These firms still make up a relatively small portion of U.S. retail, but Bread takes the threat seriously. The company’s acquisition of the original BNPL Bread company, as well as its decision to adopt the name as its own, were made with the intention of accelerating the introduction of its own competing offering.

As part of the LoyaltyOne allocation, Bread used the proceeds from the transaction to reduce its significant debt burden. This strategy is evaluated positively, as Bread uses significant borrowed funds, especially given the low credit quality of its portfolio of receivables, which historically has seen net write-offs well above the industry average. Experts still believe that more needs to be done to put Bread in a good financial position, but the additional income and associated debt reduction are a significant improvement in Bread’s balance sheet. The timing behind these steps was well chosen; the cost of lending will rise as economic growth slows and credit card debt increases, leading to an increase in net write-offs across the industry, with Bread’s credit losses being the highest in our coverage. 

On a more positive note, the company has made significant progress in expanding its retail deposit base, which currently accounts for more than a quarter of its total funding. This trend provides the company with a significant increase in net interest margin, which reduces its dependence on external financing.


Bulls opinion: 

– Bread Financial’s restructuring efforts have been very successful in reducing the company’s costs.This allowed it to effectively adapt to its smaller size and maintain profitability.

– Many Bread Financial partners rely on IT for data collection and loyalty programs. Switching costs protect these partnerships from competitive threats.

– The company’s credit card business is well capitalized, which will help protect Bread in the event of a deterioration in credit results.


Bears opinion:

– The cost of lending in Bread’s portfolio is significantly higher than that of similar companies, which exposes the firm to risk as economic conditions worsen.

– Bread Financial has a concentrated partner base, which makes it vulnerable to the loss of one or more larger partnerships.

– The company faces competitive threats from both promising firms offering BNPL services and large traditional banks, which often seek to poach its retail partners.

Investment risks in the field of sustainable development and energy transition


The exploration and production industry

The oil and gas exploration and production industry is subject to instability due to the influence of energy prices, which in turn depend on the global economy and demand. Natural gas markets in North America are more susceptible to regional factors such as the economies of the United States, Canada, and Mexico. With the increase in unconventional drilling, the regulation of these technologies poses an investment risk due to environmental issues associated with drilling practices.

From a regulatory perspective, the industry faces challenges related to wastewater disposal and state and federal drilling regulations. This may lead to additional costs for companies and a decrease in their profits. Moreover, there is a risk of legislative changes that could impact companies’ operations. Despite these risks, the industry remains attractive to investors due to high oil and gas prices. However, successful investment in this industry requires careful risk analysis and readiness for potential changes in legislation and regulation.

The cost of one barrel of Brent crude oil on 12.01.2024 is $78.01.

The natural gas futures price on 12.01.2024 is $3.17.


The oil refining industry

The oil refining market is highly unstable, with revenues heavily dependent on spot prices and current market conditions. The industry is strictly regulated, and unforeseen expenses may arise due to changes in legislation. The chemical industry is contingent upon the global economic situation.


The liquefied natural gas sector

The liquefied natural gas (LNG) sector in the United States faces several key risks, including global demand. Sustaining the growing demand for LNG requires a significant increase in global consumption.

It is anticipated that there will be an increase in demand for gas for power plants; however, there are no guarantees that governments of different countries will be able to achieve their goals of increasing generating capacity. Although the revenues of some companies involved in LNG are not directly tied to commodity prices, their clients are directly affected by the cost of importing LNG from the US compared to spot prices. If spot prices are lower than the cost of import, it could negatively impact clients, and contract fulfillment may be at risk.


The electric vehicle industry

The demand for electric vehicle batteries and charging stations is largely dependent on the electrification of transportation worldwide. If the adoption of electric vehicles slows down due to issues in OEM manufacturers’ production or consumer preferences, it will lead to a contraction in the market for these products and services.

The pace of electric vehicle deployment may be heavily influenced by political decisions, subsidies, and legislative requirements. Stock price reports and financial results may be subject to changes in policy, and forecasts may be complex due to the political nature of the process.


The global economic situation

The global economic situation is a major source of risk, as demand for raw materials is strongly correlated with economic growth. A sharp deterioration in the global economy could significantly impact results. Fluctuations in the cost of raw materials can substantially affect companies’ profitability.

Additionally, there are other threats, including managerial, environmental, regulatory, operational (accidents, incidents, protests, and weather conditions), developmental/technical, currency, and financial risks.

For the first time, ETFs for bitcoin were allowed in the US. What does this mean?

The first ETFs for bitcoin have been approved in the USA. The approval of exchange-traded funds for the first cryptocurrency was an important event for the market. Grid Capital analysts will tell you how bitcoin ETFs work and how their appearance will affect the prices of crypto assets.

The approval of the first bitcoin-based exchange-traded funds (ETFs) in the United States signifies a crucial development for the market. This regulatory decision by the Securities and Exchange Commission (SEC) opens up the opportunity for a broad range of investors to trade shares linked to cryptocurrency, providing a new avenue for capital in the crypto market.


Many years of trying

After more than a decade of waiting, the SEC has granted approval for ETFs tied to bitcoin, enabling investors to engage in cryptocurrency trading without directly handling the digital assets. Exchange-traded funds have gained popularity due to their convenience and diverse investment options, allowing investors to trade baskets of assets like stocks on traditional stock exchanges.

Despite previous rejections, the recent approval reflects a shift in the SEC’s stance, influenced in part by a legal battle involving Grayscale, a major player in the cryptocurrency space. Grayscale’s successful lawsuit against the SEC in 2022 challenged the denial of spot bitcoin funds, and this victory is considered a turning point in the regulatory landscape, leading to the recent approval of bitcoin ETFs.

Several prominent entities, including BlackRock, Fidelity, Franklin Templeton, ARK Invest, Grayscale, Hashdex, and Valkyrie, have received approval to launch ETFs, vying for the position of pioneers in the bitcoin ETF market. The infrastructure supporting these ETFs involves major players like Coinbase, which provides bitcoin storage, and market makers such as Jane Street and Virtu.

Custodial custody, a crucial aspect of the process, ensures the secure storage of billions of dollars worth of bitcoins, protecting them from loss, theft, or cyber attacks. The entry of spot ETFs into the American market necessitates monitoring the influx of capital and observing which among the 11 approved issuers captures the largest market share.


Digital Gold

This development is expected to democratize access to cryptocurrency investments, similar to the impact of gold ETFs in making gold investments more accessible. Institutional investors, previously limited in their ability to invest directly in cryptocurrency, can now participate in the market through regulated ETFs, mitigating the challenges associated with storing and trading digital assets.

Drawing parallels with the trajectory of gold ETFs (the first ETFs for gold appeared 20 years ago, and since then the metal has quadrupled in price), analysts from Standard Chartered Bank predict a significant rise in the price of bitcoin following the approval of spot ETFs in the United States. They anticipate a price surge to $100,000 by the end of 2024, projecting a shorter timeframe for this growth compared to the historical performance of gold.

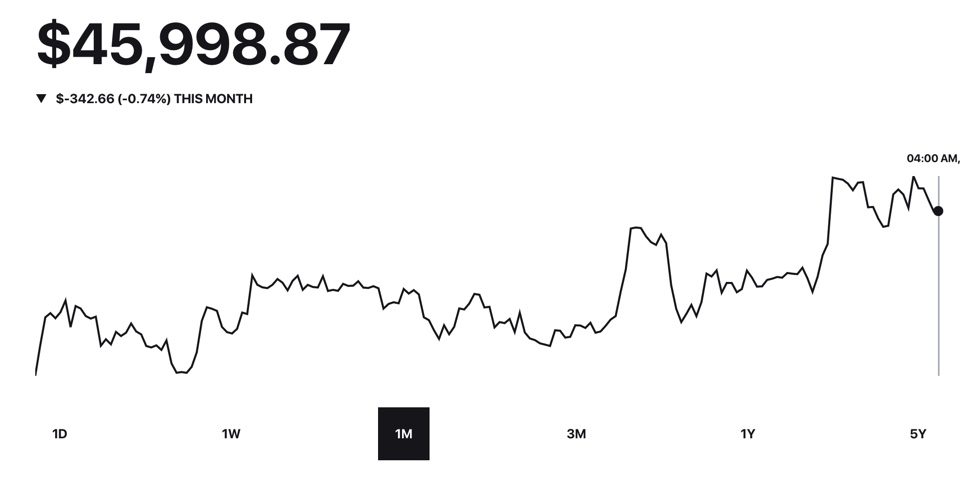
In 2023, bitcoin soared in price by more than 150%. A significant part of this growth followed BlackRock’s June application to create an ETF — before that, bitcoin was trading at around $25 thousand.


At the time of publication of this material, the exchange rate of the first cryptocurrency is at the level of $46 thousand.


Consumer Finance Weekly – DFS, BFH, OMF, BNPL, Banking, Student Loans, Cars

DFS

The appointment of Mikhail Rodos as the CEO and President of DFS marks a significant milestone for the company. Having recently led the private client group at TD Canada Trust, and with prior senior management roles at BAC and MBNA America Bank, his arrival is anticipated to bring about positive changes for DFS.


BFH

BFH has revealed the issuance of its 9.75% bonds maturing in 2029, with a total value of $600 million. This amount represents an increase from the initially announced $500 million, leading to a rise in annual interest expenses by approximately $20 million. However, this move also serves to significantly prolong the maturity dates, which is a noteworthy development for the company.


OMF

On December 13, 2023, OMF successfully issued unsecured bonds worth $700 million, due in 2030 and carrying a rate of 7.875%. The net proceeds from this issuance will be utilized to repay the remaining portion of OMF’s outstanding senior notes, which currently yield 6.125%, as well as for general corporate purposes. As a result, the impact on financing costs is expected to be only marginally higher, representing a favorable outcome compared to the issuance in May 2020.


BNPL

Google Pay has revealed a test initiative in collaboration with Affirm and Zip, providing a variety of BNPL payment choices at specific clothing/accessory boutiques, cinemas, and travel bureaus in the US when utilizing Google Pay for online transactions. Upon clicking the Google Pay button while engaging in a transaction with a participating vendor in the trial program, consumers will be presented with an advertisement banner informing them of the opportunity to utilize BNPL through Affirm or Zip. This serves as a compelling demonstration of the increasing popularity of BNPL as a payment method.

Affirm, a BNPL service provider, is partnering with Blackhawk to enable customers to utilize Affirm for the acquisition of digital gift cards. Following approval, customers have the option to select from Affirm’s installment payment schemes. BNPL is gaining traction as a more prevalent payment method, although it should be noted that the purchase of gift cards is more vulnerable to fraudulent activities.


Banking Regulation

Jonathan McKeon, a member of the FDIC board, has proposed that regulators could embrace the less contentious elements of the final “Basel-3” document while deferring more contentious sections for further examination. Analysts believe that the likelihood of partial adoption remains low, but it is crucial to monitor whether others, such as Federal Reserve Vice Chair Michael Barr, will begin to endorse this approach.


Transactions

The latest report from the Federal Reserve System indicates that 331 financial institutions have adopted FedNow, a real-time payment system. Launched in July with 35 initial participants, the service is anticipated to experience continued growth throughout 2024. However, it will require some time before the majority of financial institutions in the US embrace this system.


Federal Student Loan Repayment Statistics

As per the most recent data from the US Treasury, as of December 13th, the volume of repayments on federal student loans for borrowers was marginally lower in the first two weeks of December compared to the preceding month – November. The total repayment amount for December stood at $60 billion, which was less than the $64 billion in November, $83 billion in October, and $84 billion in September. Nonetheless, it marked a significant increase from December 2022, which only amounted to $14 billion.


The new rules of the FTC (Federal Trade Commission) for the car dealers

The Federal Trade Commission has updated a fresh set of regulations, scheduled to come into force next summer (on July 30), with the aim of safeguarding consumers from deceptive practices when buying a vehicle, as per an announcement from the agency. The revised regulations are projected to result in savings of over $3.4 billion for consumers nationwide and an estimated reduction of 72 million hours spent on car purchases by outlawing “bait and switch” maneuvers and undisclosed fees for disposal, as outlined in a press release from the FTC.

Analysts anticipate that the regulations will encompass supplementary offerings linked to the sale or financing of automobiles, particularly extended service contracts. It is important to mention that CACC offers dealers the chance to provide extended service contracts (vehicle warranties) through an external provider. In the third quarter of 2023, CACC’s earnings from reinsurance premiums on vehicle service contracts (VSC) totaled $20.8 million, along with a portion of earnings from accompanying products during the VSC period ($7.8 million in the third quarter of 2023) and administrative charges received under VSC agreements, classified as financing expenses.

CACC aims to ensure that these programs comply with relevant laws and regulations, although this may eventually exert pressure on revenue streams.

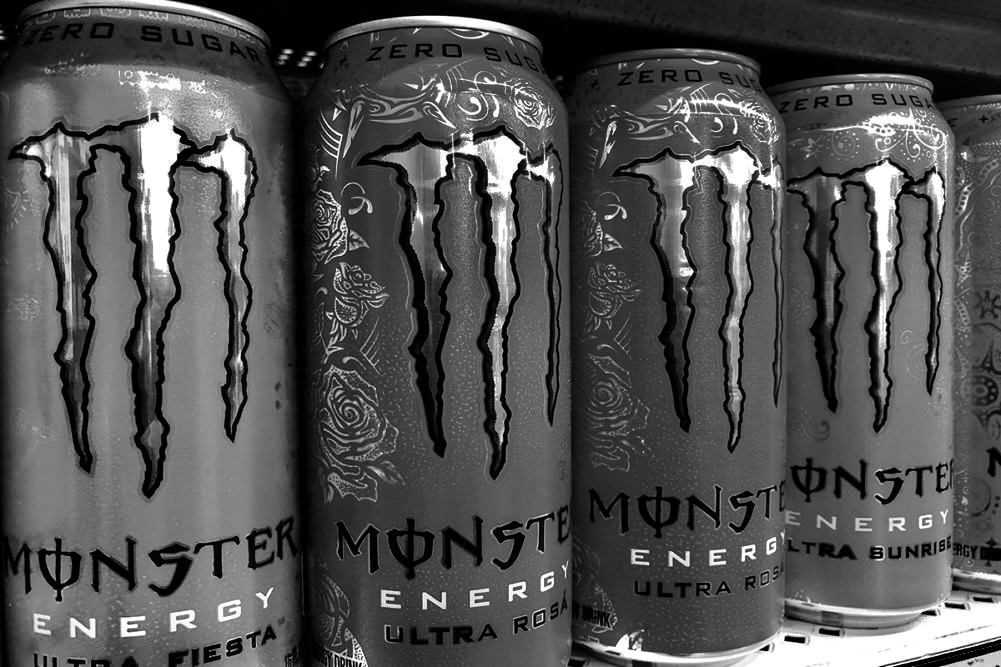
Monster Beverage, a leader in the energy drink segment

Fair Value | 43.00 USD
Market Cap | 55.25B USD


Monster Beverage continues to show steady growth and impressive profitability twenty years after its revolutionary debut in the US energy drink market. Despite its heavy reliance on the famous Monster brand, which seems limited to the energy category, the company is poised for further expansion by broadening the beverage consumption opportunities. This strategic maneuver is expected to sustain the company’s steady growth in the long term.


The power of partnership Coca‑Cola and Monster

Monster Beverage has established a key partnership with Coca-Cola, providing unprecedented advantages in distribution, merchandising, and negotiations with retailers. The integration of Monster’s entire US territory into Coca-Cola’s system enhances strategic and logistical planning, facilitating rapid scaling, especially in international markets, where about 35% of sales are realized. Despite the challenges in satisfying different local tastes, Monster’s geographic diversity should strengthen its market position.


Overcoming difficulties: Coke Energy and the competitive environment

Although the launch of Coke Energy products after negotiations between the companies was a significant event, it did not pose a threat to existence, gaining a small market share before recently ceasing sales in the US. Regardless of Coca-Cola’s future plans in the energy category, it is expected that Monster will maintain its strong position, especially among core consumers who have been loyal to the brand for many years. 

In addition to the dynamics of its relationship with Coca-Cola, Monster faces a competitive environment where Red Bull is a formidable competitor, as well as a number of established and new firms seeking to make a name for themselves in the energy sector. However, structural advantages and experienced leadership should enable the company to successfully navigate the changing competitive landscape.


Bull’s opinion

– Monster is the leading representative in the rapidly growing segment of beverages, which is growing at a significantly higher rate than the industry average (low single digits).

– The strategic partnership with Coca-Cola ensures better shelf placement in stores and efficient merchandising.

– International expansion through Coca-Cola’s bottling system provides substantial growth opportunities.


Bear’s opinion

– The presence of outsourcing results in a relatively smaller operational leverage in the company’s business model.

– The potential negative impact on the partnership with Monster, which the company relies on to a greater extent, could occur due to additional steps taken by Coca-Cola in the energy category.

– The lack of product portfolio diversification in Monster can pose a problem, particularly as the popularity of the energy drinks category decreases.

Resolution of the EHAB Strategic Review Process

The bulk of Enhance Home Health & Hospice’s revenue comes from patients using traditional Medicare and Medicaid Advantage programs, which together account for more than 90% of the company’s consolidated revenue.

In September 2023, they announced the formal start of the strategic review process. The assets of Home health agencies (HHA) have shown their strategic value to several parties, including health management organizations.

Assets in the field of home healthcare and hospice care will continue to be attractive to healthcare management organizations (MCOs) as the expansion of the value-based care (VBC) model is strengthened in their strategy. Companies such as UNH and HUM, which served 47% of Medicare Advantage (MA) participants in 2023, have acquired specialized national platforms: HUM acquired Kindred, and UNH acquired LHCG and AMED.

The dual effect of running a business that generates positive margins and free cash flow, combined with the ability to transfer participants to care settings that are twice as cheap as inpatient facilities such as long-term care facilities (SNF), should be attractive to the MCO, which currently does not operate a national platform.

Enhabit trades at about 11 times its EBITDA, which gives a discount of 43% and 24% compared to the acquisition multiplicity of LHCG and AMED, respectively. The probability of a sale is about 50/50, and for an MCO with a large business under the Medicare Advantage program, such a deal seems the most logical; approximately 90% of EHAB’s income from HHA comes from Medicare.

Macroeconomic trends and further growth 

From 2020 to 2030, the number of people over the age of 65 in the United States is expected to increase by about 30% and reach 73 million people. This age group will make up almost one fifth of the country’s population. This segment of the population is expected to drive health spending of approximately $250 billion due to the likely increase in the burden of disease and the desire of patients to avoid long-term stays in institutional settings such as long-term care facilities (SNF).

Each of EHAB’s two business segments is located in an extremely fragmented sector, where most competitors are represented by small, localized operators who face increasingly difficult business conditions. EHAB has experience in conducting acquisitions, but the current credit burden makes new acquisitions unlikely in the near future. Despite this, the company can continue to use its scale, size and quality of results to increase market share by attracting customers from smaller operators, while at the same time demonstrating its value to partners in the field of payment services.

Innovation strategy 

The Payer Innovation Team was established in May 2022 with the aim of focusing on maintaining the growth of home healthcare while achieving attractive tariffs and stimulating an increase in episodic care. As the number of Medicare eligible individuals who enroll in the Medicare Advantage (MA) program has increased, this strategy has become vital in light of the perceived ability to negotiate with healthcare organizations managing contracts. EHAB continues to negotiate national contracts and seeks to strengthen the strategy of regional agreements.

Since the start of the project, the company has successfully negotiated 48 new contracts, about two thirds of which are designed for occasional payment. In the third quarter of 2023, EHAB admitted more than 6,000 patients under these new contracts, an increase of 72% compared to the previous period.

Non-recurring tariffs are now at a 25-30% discount versus the historical 35-40%, and EHAB estimates that each 5% move to new innovative contracts increases annual revenue and adjusted EBITDA by about $2 million. 

The Tax-free status may become an obstacle

Despite receiving approval to explore strategic alternatives from Encompass in August, the press release states: “Certain transactions involving the company are still subject to additional conditions under the Tax Matters Agreement (TMA), including the need to obtain an additional tax opinion on a specific transaction, which must satisfy Encompass Health on their sole and the absolute discretion that such a proposed transaction would not jeopardize the tax-free status of the Enhance branch.

There can be no certainty that the process of exploring strategic alternatives to the company will lead to the fact that Enhance will decide on a deal that would satisfy the remaining conditions in TMA.”

Performing tax–free divisions is an extremely difficult task, and we understand that in certain transaction scenarios EHAB will still be subject to additional conditions, including obtaining an additional tax opinion and the need for its approval by Encompass Health at their sole and absolute discretion, so that the specifically proposed transaction does not threaten the non-tax status of the EHAB branch.

US Retail Traffic: November Data Overview

Retail Traffic in the United States

Overall retail traffic in the United States increased by +5.0% year over year (YoY) during the Black Friday weekend, compared to +0.1% year over year (YoY), owing to warmer and more humid weather conditions. Furthermore, garment traffic in the US climbed by +3.3% year on year, outpacing the preceding period’s +1.9% year on year gain.

November’s average total traffic was +5.5% month-to-date (MTD), the lowest monthly result this year. Meanwhile, Redbook’s weekly sales increased by +6.3%, surpassing the previous week’s +3.4%.

Retail traffic increased by +5.0% year on year in the fourth week of November, compared to +3.3% the previous week. After experiencing unfavorable variations at the beginning of November, retail traffic in the United States has recovered over the past two weeks. During the fourth week of November, traffic was +9.0% more than in 2019, outpacing the prior week by 17.8%.

Despite the Black Friday surge, fall traffic in November continues to slow, with the month’s average retail traffic now at +1.5% YoY, lower than the October average (+3.1%) and September average (+3.0%). Summer traffic increase peaked in July (+7.0% year on year), outpacing June and May by +4.4% and +5.5%, respectively.

Snowfall in the fourth week of November was more than three times more than in 2022. This week was both the warmest since 2020 and the snowiest in three years. Temperatures fell across the country, increasing demand for seasonal goods.

Snowfall fell throughout many places, increasing snowfall by 250% year over year. The balanced XRT increased by +6.8% year to date but declined by 2.2% year to date as of November 29, 2023, underperforming the S&P 500, which increased by +18.9% year to date and +15.0% year to year.


Retail Traffic Forecast for Dec Week 1

Based on November statistics, it is expected that retail traffic in the United States will climb by 10% in the first week of December. The first week of December is projected to be the coldest since 2018, according to Weather Trends International (“WTI”), possibly benefiting winter categories. Snow will continue to fall in New England and the Great Lakes, although temperatures are forecast to climb this week. Temperatures on the West Coast are forecast to stay steady with the previous week, while storms may bring wetter weather to the Northwest.


Now W4: Warmer and Much Snowier Than Last Year

The fourth week of November was +1.4°F warmer than the previous year and +1.2°F warmer than the historical average, according to Weather Trends International data. Precipitation was 36% higher than in 2022, while snowfall was 250% higher. Despite a large increase in snowfall compared to 2022, last year’s snowfall was exceptionally low at this time.

The week began rather warm, but by the weekend, temperatures had dropped significantly, increasing demand for seasonal presents. Snowstorms may have limited store visits, but they have also increased demand for winter clothes and cold-weather supplies.


Clothing Traffic W4 November

Clothing sales in the United States increased by 3.3% year on year (ended November 25, 2023), compared to +1.9% the previous week (Figure 2 below). The average clothes shop visitation in November was +1.0% YoY, the lowest since 2023, and was lower than the October average (+2.1%), matching September’s (+2.1%) and falling short of August’s (+3.9%). Clothing traffic in the fourth week of November was 6.4% lower than in the previous week (by 11.8%).